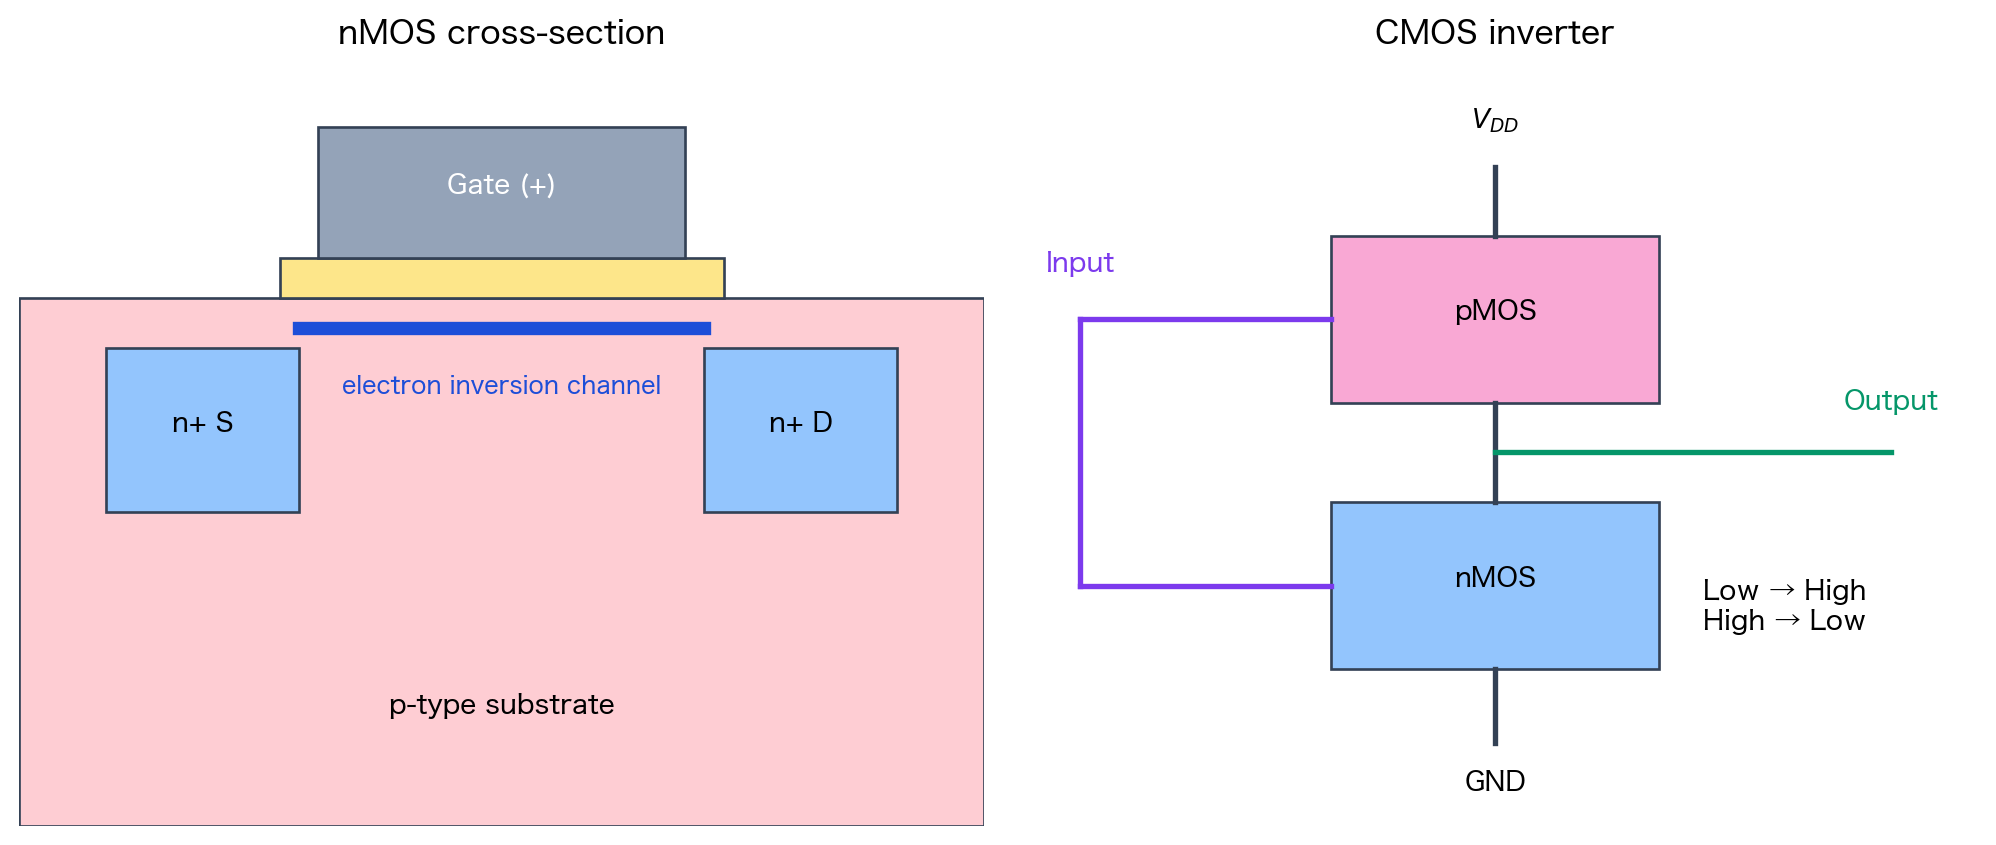
import matplotlib.pyplot as plt
from matplotlib.patches import Rectangle

fig, axes = plt.subplots(1, 2, figsize=(10.5, 4.5))

# nMOS cross-section
ax = axes[0]
ax.add_patch(Rectangle((0, 0), 5, 2.1, facecolor="#fecdd3", edgecolor="#334155"))
ax.text(2.5, 0.45, "p-type substrate", ha="center")
ax.add_patch(Rectangle((0.45, 1.25), 1.0, 0.65, facecolor="#93c5fd", edgecolor="#334155"))
ax.add_patch(Rectangle((3.55, 1.25), 1.0, 0.65, facecolor="#93c5fd", edgecolor="#334155"))
ax.text(0.95, 1.57, "n+ S", ha="center")
ax.text(4.05, 1.57, "n+ D", ha="center")
ax.add_patch(Rectangle((1.35, 2.1), 2.3, 0.16, facecolor="#fde68a", edgecolor="#334155"))
ax.add_patch(Rectangle((1.55, 2.26), 1.9, 0.52, facecolor="#94a3b8", edgecolor="#334155"))
ax.text(2.5, 2.52, "Gate (+)", ha="center", color="white")
ax.plot([1.45, 3.55], [1.98, 1.98], color="#1d4ed8", lw=5)
ax.text(2.5, 1.72, "electron inversion channel", ha="center", color="#1d4ed8", fontsize=9)
ax.set_title("nMOS cross-section")
ax.set_xlim(0, 5)
ax.set_ylim(0, 3.05)
ax.axis("off")

# CMOS logic concept
ax = axes[1]
ax.text(2.5, 3.55, r"$V_{DD}$", ha="center")
ax.plot([2.5, 2.5], [3.35, 3.0], color="#334155", lw=2)
ax.add_patch(Rectangle((1.65, 2.15), 1.7, 0.85, facecolor="#f9a8d4", edgecolor="#334155"))
ax.text(2.5, 2.58, "pMOS", ha="center")
ax.add_patch(Rectangle((1.65, 0.8), 1.7, 0.85, facecolor="#93c5fd", edgecolor="#334155"))
ax.text(2.5, 1.22, "nMOS", ha="center")
ax.plot([2.5, 2.5], [2.15, 1.65], color="#334155", lw=2)
ax.plot([2.5, 2.5], [0.8, 0.42], color="#334155", lw=2)
ax.text(2.5, 0.18, "GND", ha="center")
ax.plot([0.35, 1.65], [2.58, 2.58], color="#7c3aed", lw=2)
ax.plot([0.35, 1.65], [1.22, 1.22], color="#7c3aed", lw=2)
ax.plot([0.35, 0.35], [1.22, 2.58], color="#7c3aed", lw=2)
ax.text(0.35, 2.82, "Input", ha="center", color="#7c3aed")
ax.plot([2.5, 4.55], [1.9, 1.9], color="#059669", lw=2)
ax.text(4.55, 2.12, "Output", ha="center", color="#059669")
ax.text(4.0, 1.0, "Low → High\nHigh → Low", ha="center")
ax.set_title("CMOS inverter")
ax.set_xlim(0, 5)
ax.set_ylim(0, 3.9)
ax.axis("off")

plt.tight_layout()
plt.show()