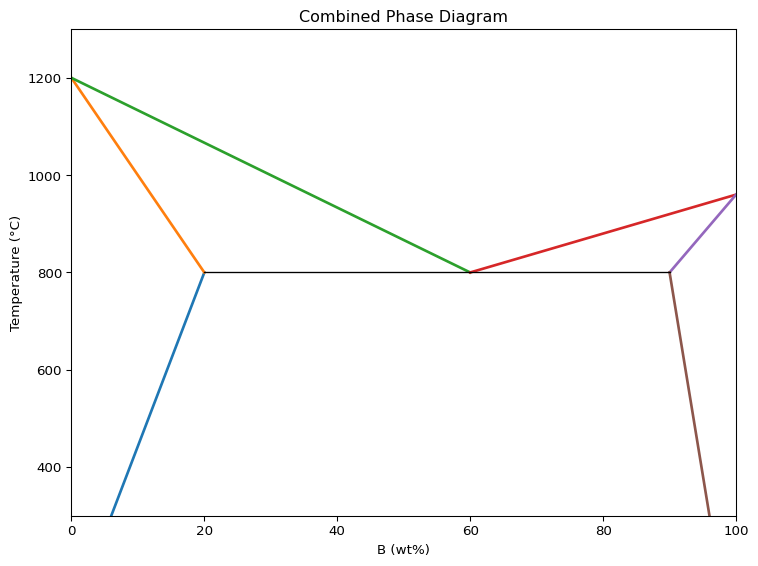
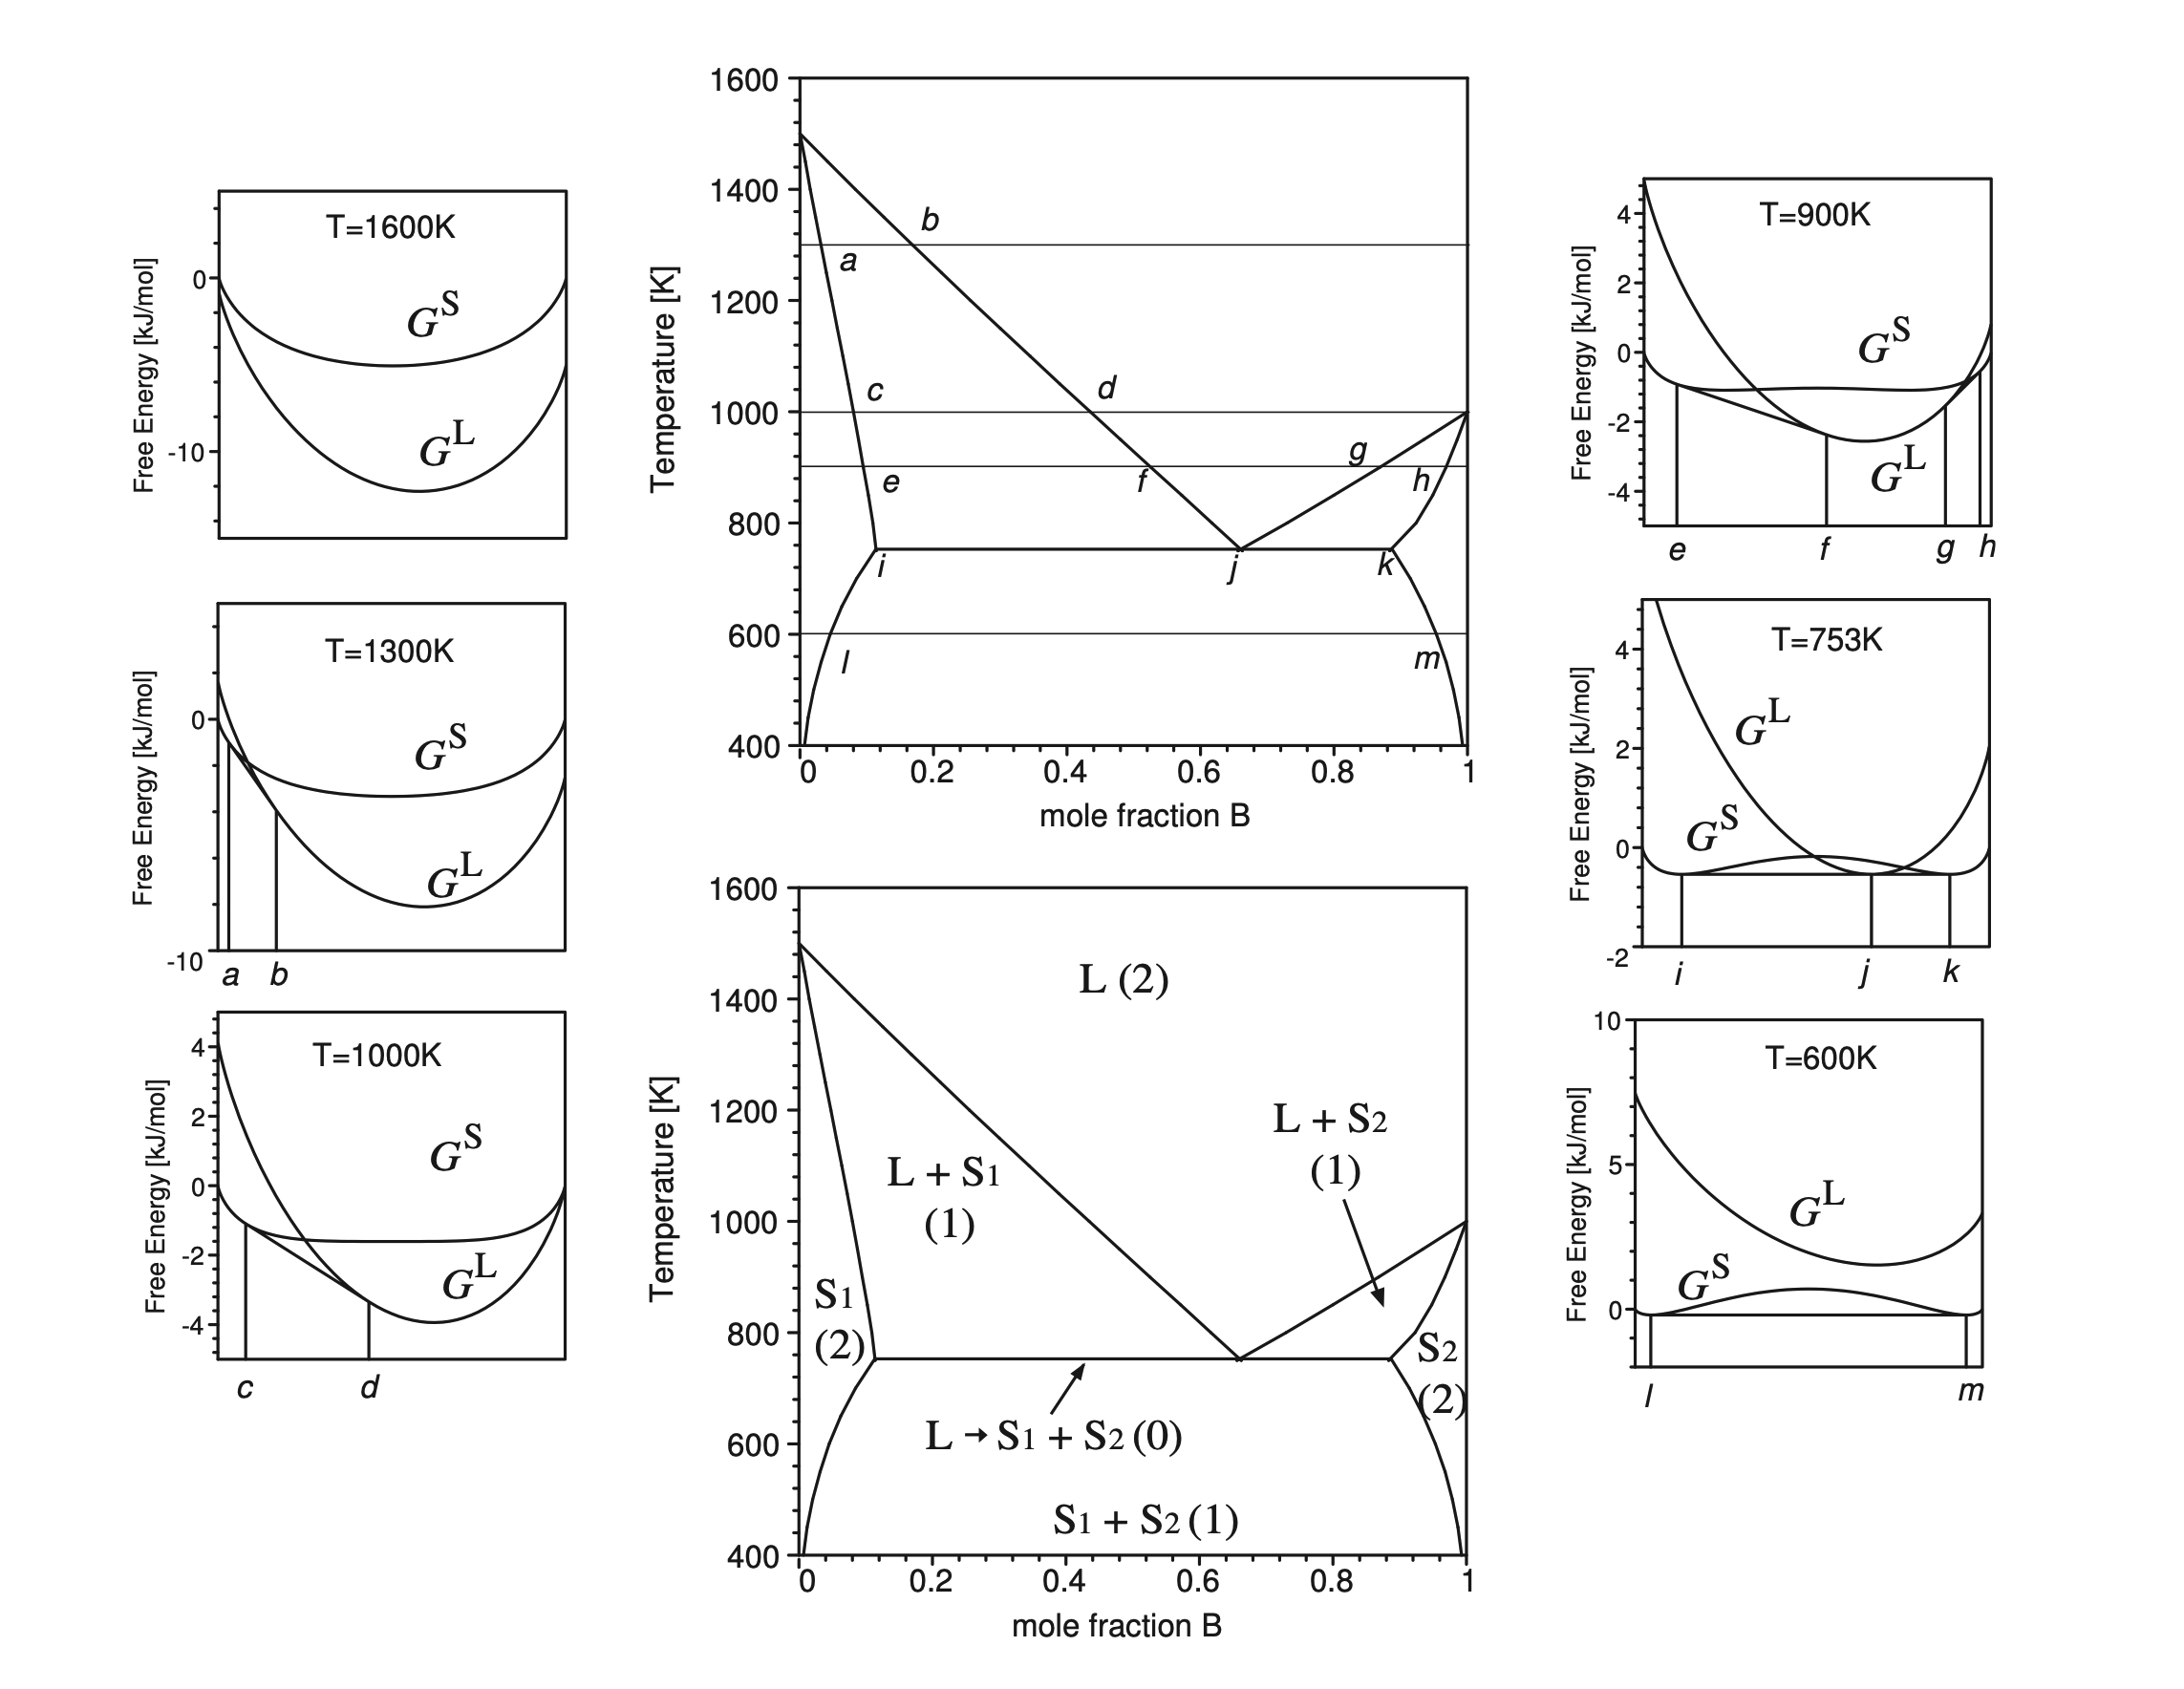
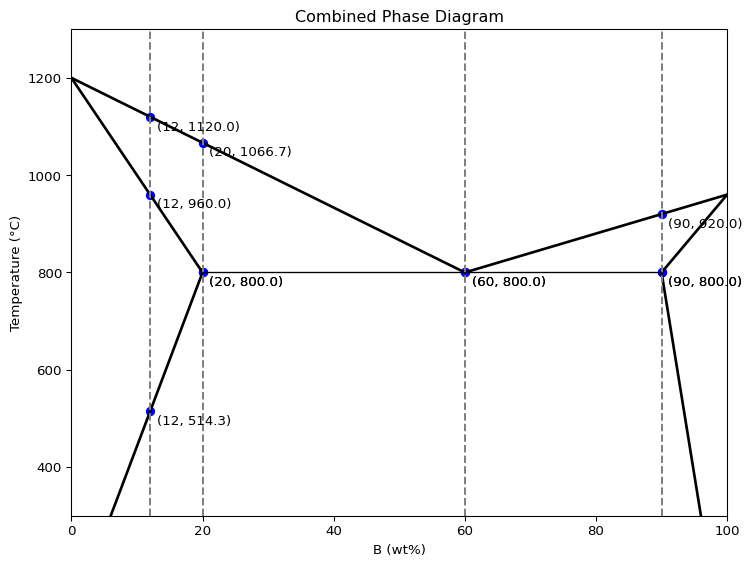
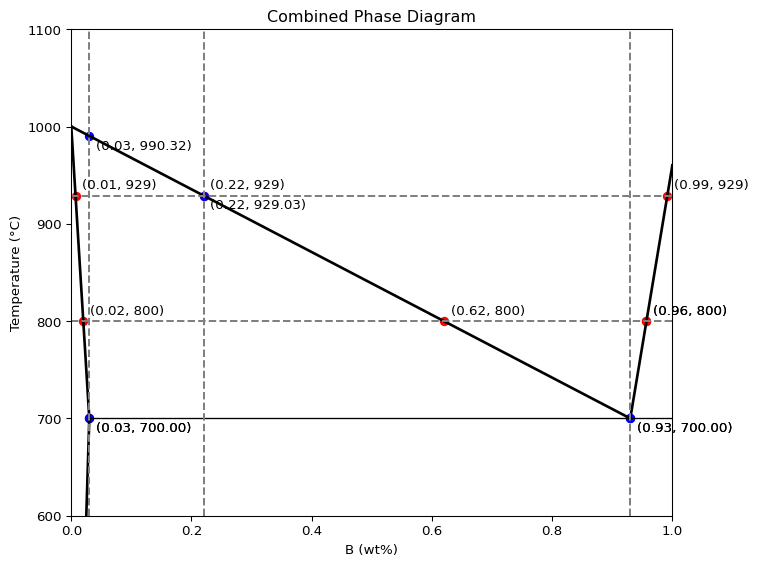
import numpy as np
import matplotlib.pyplot as plt

# --- ヘルパー関数 ---
def bezier_curve(P, Q, offset_y, t):
    """2次ベジェ曲線を返す"""
    mid = (P + Q) / 2
    C = mid + np.array([0, offset_y])
    return np.outer((1 - t)**2, P) + np.outer(2*(1 - t)*t, C) + np.outer(t**2, Q)

def line_interpolate(P, Q, x=None, y=None):
    """
    直線上の補間
    x 指定 → y,  y 指定 → x
    """
    x0, y0 = P
    x1, y1 = Q
    if x is not None and y is None:
        return y0 + (y1 - y0) / (x1 - x0) * (x - x0)
    if y is not None and x is None:
        return x0 + (x1 - x0) / (y1 - y0) * (y - y0)
    raise ValueError("x か y のどちらか片方を指定")

# --- 主要点の設定 ---
A       = np.array([0.025,  600])
point0  = np.array([ 0.03,  700])
point1  = np.array([  0, 1000])
point2  = np.array([ 0.93,  700])
point3  = np.array([1,  960])
point4  = np.array([ 2,  700])
B       = np.array([ 2,  300])

# ベジェ曲線の定義
segments = [
    (A,      point0, 0),
    (point0, point1, 0),
    (point1, point2, 0),
    (point2, point3, 0),
    (point3, point4, 0),
    (point4, B,      0),
]
t = np.linspace(0, 1, 300)
curves = [bezier_curve(P, Q, off, t) for P, Q, off in segments]

# --- プロット ---
fig, ax = plt.subplots(figsize=(8, 6))
ax.set_xlim(0, 1)
ax.set_ylim(600, 1100)
ax.set_xlabel('B (wt%)')
ax.set_ylabel('Temperature (°C)')
ax.set_title('Combined Phase Diagram')

# ベジェ曲線描画
for curve in curves:
    ax.plot(curve[:,0], curve[:,1], color='black', lw=2)

# point0-point4 の直線
ax.plot([point0[0], point4[0]], [point0[1], point4[1]],
        linestyle='-', color='black', lw=1)

# 水平線
y_lines = [800, 929]
for y_h in y_lines:
    ax.axhline(y=y_h, linestyle='--', color='gray')
    # 交点計算
    for curve in curves:
        xs, ys = curve[:,0], curve[:,1]
        idx = np.where((ys[:-1]-y_h)*(ys[1:]-y_h) <= 0)[0]
        for i in idx:
            x0, y0 = xs[i], ys[i]
            x1, y1 = xs[i+1], ys[i+1]
            x_cross = x0 + (y_h-y0)/(y1-y0)*(x1-x0)
            ax.scatter(x_cross, y_h, color='red')
            ax.annotate(f'({x_cross:.2f}, {y_h})', (x_cross, y_h),
                        textcoords='offset points', xytext=(5,5))

# 垂直線
x_lines = [0.03, 0.93, 0.22]
for x_v in x_lines:
    ax.axvline(x=x_v, linestyle='--', color='gray')
    # 交点計算
    for curve in curves:
        xs, ys = curve[:,0], curve[:,1]
        idx = np.where((xs[:-1]-x_v)*(xs[1:]-x_v) <= 0)[0]
        for i in idx:
            x0, y0 = xs[i], ys[i]
            x1, y1 = xs[i+1], ys[i+1]
            # 線形補間
            y_cross = y0 + (y1-y0)/(x1-x0)*(x_v-x0)
            ax.scatter(x_v, y_cross, color='blue')
            ax.annotate(f'({x_v}, {y_cross:.2f})', (x_v, y_cross),
                        textcoords='offset points', xytext=(5,-10))

plt.tight_layout()
plt.show()