import numpy as np
import matplotlib.pyplot as plt
import math
# --- Vertices of ternary diagram ---
V_CaO = np.array([0.0, 0.0])
V_Al = np.array([1.0, 0.0])
V_Si = np.array([0.5, math.sqrt(3)/2])
def bary_to_xy(cao, al, si):
s = cao + al + si
cao, al, si = cao/s, al/s, si/s
return cao*V_CaO + al*V_Al + si*V_Si
fig, ax = plt.subplots(figsize=(7, 6))
# --- Draw triangle ---
tri = np.vstack([V_CaO, V_Al, V_Si, V_CaO])
ax.plot(tri[:,0], tri[:,1], color="black")
# --- Axis ticks every 10% ---
ticks = np.linspace(0.1, 0.9, 9)
# SiO2 ticks (parallel to base)
for s in ticks:
p1 = bary_to_xy(1-s, 0, s)
p2 = bary_to_xy(0, 1-s, s)
ax.plot([p1[0], p2[0]], [p1[1], p2[1]], color="lightgray", linewidth=0.8)
ax.text(p2[0]+0.02, p2[1], f"{int(s*100)}%", fontsize=8, va="center")
# CaO ticks (parallel to Al2O3–SiO2 edge)
for c in ticks:
p1 = bary_to_xy(c, 1-c, 0)
p2 = bary_to_xy(c, 0, 1-c)
ax.plot([p1[0], p2[0]], [p1[1], p2[1]], color="lightgray", linewidth=0.8)
# Al2O3 ticks (parallel to CaO–SiO2 edge)
for a in ticks:
p1 = bary_to_xy(1-a, a, 0)
p2 = bary_to_xy(0, a, 1-a)
ax.plot([p1[0], p2[0]], [p1[1], p2[1]], color="lightgray", linewidth=0.8)
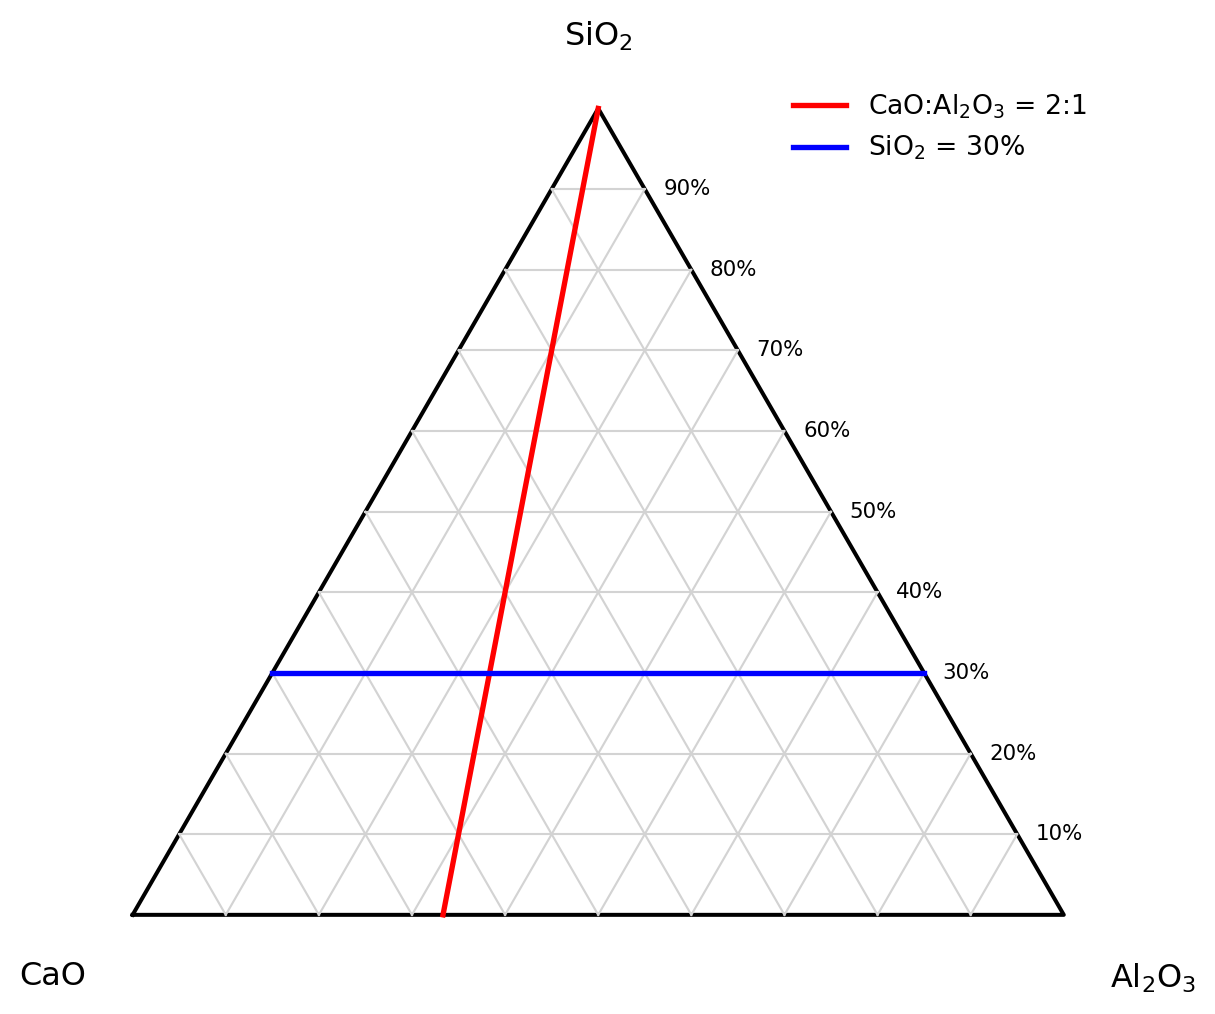
# --- Highlight required lines ---
# CaO : Al2O3 = 2 : 1
t = np.linspace(0, 1, 200)
cao = (2/3) * (1 - t)
al = (1/3) * (1 - t)
si = t
xy_ratio = np.vstack([bary_to_xy(cao[i], al[i], si[i]) for i in range(len(t))])
ax.plot(xy_ratio[:,0], xy_ratio[:,1], color="red", linewidth=2, label="CaO:Al$_2$O$_3$ = 2:1")
# SiO2 = 30%
p1 = bary_to_xy(0.70, 0.00, 0.30)
p2 = bary_to_xy(0.00, 0.70, 0.30)
ax.plot([p1[0], p2[0]], [p1[1], p2[1]], color="blue", linewidth=2, label="SiO$_2$ = 30%")
# --- Labels ---
ax.text(V_CaO[0]-0.05, V_CaO[1]-0.05, "CaO", ha="right", va="top", fontsize=12)
ax.text(V_Al[0]+0.05, V_Al[1]-0.05, "Al$_2$O$_3$", ha="left", va="top", fontsize=12)
ax.text(V_Si[0], V_Si[1]+0.06, "SiO$_2$", ha="center", va="bottom", fontsize=12)
ax.set_aspect("equal")
ax.axis("off")
ax.legend(loc="upper right", frameon=False)
plt.show()